07/10/21
Street-level maps to help plan for floods, disasters

By: Melanie Sison
Send to a friend
The details you provide on this page will not be used to send unsolicited email, and will not be sold to a 3rd party. See privacy policy.
[MANILA] A tool that generates street-level maps of areas with high flood risk promises to aid future disaster planning as climate change increases the frequency and intensity of extreme weather events.
The free online World Flood Mapping Tool is geared particularly towards countries in the global South, where flood risk maps are rarely available and often out-dated, and where communities are most vulnerable.
According to the World Bank, 89 per cent of people exposed to flood risk live in low- and middle-income countries, which often lack the infrastructure to cope.
The tool, developed by the UN University’s Institute for Water, Environment and Health (UNU-INVEH) with Google and other partners, uses the Google Earth engine combined with satellite (Landsat) data from 1985 onwards. Besides detailed maps of flooding during this period, it has overlays showing population, buildings and land use to help in the planning of resilient developments and infrastructure.
“With limited resources to observe and record previous floods, the global South can use this tool as an alternative to finding out inundation distributions in the past. Those are essential in identifying vulnerable areas for floods which can be considered in future flood risk management actions,” Hamid Mehmood, a UNU-INWEH remote sensing specialist who led the tool’s development, tells SciDev.Net.
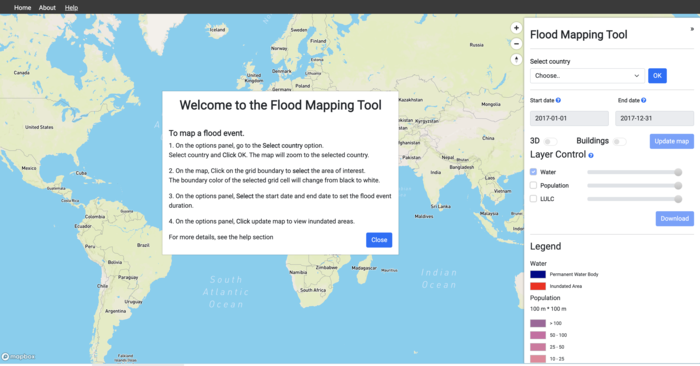
The World Flood Mapping tool generates street-level maps of areas with high flood risk. Credit: UNU-INWEH.
Mehmood says that the tool is user-friendly and “can easily be handled by even a junior professional with a background in floods to identify the historical flood inundation in any particular location of interest”. Potential users of the tool include forecasting institutions, UN agencies, government agencies, research institutions, farmers, real estate developers and insurance companies, he says.
The maps, which can be generated in less than a minute, were validated using documented flooding events in countries including Bangladesh, India, Sri Lanka, Thailand and Mozambique. They are said to have 82 per cent accuracy.
“Painting a detailed picture of the historical and potential flood risk areas will be invaluable for any urban and regional planning department,” said project collaborator Duminda Perera of UNU-INWEH in a statement.
The next stage of the tool development — which will be made available for commercial use — is to zoom down to the building level, even incorporating occupancy data.
This tool is one of the latest to be developed that allows users to look at maps that show the impact — potential or actual — of climate change at the granular level. This is critical for countries such as the Marshall Islands that are highly vulnerable to sea-level rise, as well as typhoons and droughts that threaten the territory’s capacity to support human habitation.
Artessa Saldivar-Sali, a senior municipal engineer at the World Bank, says that these maps look at three elements: the actual hazards, which factors in both the frequency and intensity vis-à- the geography of a given area; exposure, particularly in terms of population distribution; and level of vulnerability.
In the Marshall Islands, these three elements were factored in when developing the geographical information system (GIS) maps that show areas susceptible to threats such as sea-level rise and coastal erosion as well as
the level of risk each building is exposed to. The tool also factors in the different scenarios presented by the UN’s Intergovernmental Panel on Climate Change which vary based on projected carbon emissions.
“[With maps], it’s easier to see the bigger picture,” Saldivar-Sali says. “It serves as an illustrative tool to compare different scenarios.” The maps help governments better understand the extent of their vulnerability so they can make climate adaptation plans for the next 100 years.
Besides using the maps as tools for local planning, the Marshall Islands is also set to use it in the upcoming COP26 to act more decisively in response to the threats posed by climate change.
In the case of the International Federation of Red Cross and Red Crescent Societies, GIS maps are not just used to inform strategies and policies but also to determine humanitarian support in areas that have or are projected to experience severe climate extremes. GIS maps are used throughout the disaster management cycle, says Madhab Uprety, who is technical adviser at the Red Cross Red Crescent Climate Centre in Kathmandu.
“Climate change is also a humanitarian problem and we can’t separate it, so we need to factor how we can adapt to climate change in the coming years and how we can adapt to it in our operational systems,” Uprety says.
“Climate change is also a humanitarian problem and we can’t separate it, so we need to factor how we can adapt to climate change in the coming years and how we can adapt to it in our operational systems”
Madhab Uprety, Red Cross Red Crescent Climate Centre
Granular maps, says Uprety, make it easier to see the direct impact of climate risks and hazards. “Downscaling projections to the local context and coming up with an impact scenario, or potential scenarios on how certain sectors can be affected, such as agricultural and medical, enables us to come up with a viable and appreciable response.”
Uprety, however, acknowledges that tools such as GIS and other mapping tools that are paid and licensed software may be less suitable and sustainable to developing countries that have limited resources. He stresses the need for the adoption of open-source tools and platforms to avoid running costs.
Peeranan Towashiraporn, director of the geospatial information department of the Asian Disaster Preparedness Centre, says that existing tools can be tapped by countries that are unable to generate their own maps. He says there are mechanisms such as Sentinel Asia and the International Charter Space and Major Disasters that allow countries to access satellite-based products such as flood maps. Other international organisations such as the UN World Food Programme, and the UN Satellite Centre are also making disaster maps.
Uprety says that tech giants such as Google and Facebook are now showing interest in developing maps of areas affected by climate extremes like floods. He adds that the possibility of acquiring information in real-time will help humanitarian responders understand what is happening on the ground.
This piece was produced by SciDev.Net’s Asia & Pacific desk.