By: Gareth Willmer
Send to a friend
The details you provide on this page will not be used to send unsolicited email, and will not be sold to a 3rd party. See privacy policy.
Creating maps in unprecedented detail is aiding efforts from vaccination to disaster relief. Gareth Willmer reports.
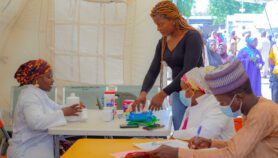
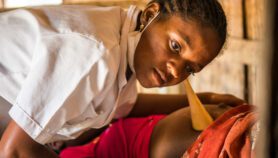
Just a few years ago, Nigeria was one of three countries still recording polio cases. So the stakes were high for its vaccination tracking programme: it simply had to work.
It took budgeting and planning — where to send vaccinators, for example, or how much vaccine was needed. It also needed reliable data to determine the number of children under five years old (who are eligible for the vaccine), and where they were.
No new polio cases have been reported since 2016. So what changed?
It was having the data to map locations with a polio resurgence that has been “one of the game changers”, says Yau Inuwa Barau at Nigeria’s National Primary Health Care Development Agency (NPHCDA).
All in the detail
The situation is now very different to when Nigeria was first hit by a polio resurgence that saw about 200 cases recorded in 2011 and 2012 combined — a major setback after a previous drop in numbers.
“When we looked at the cases, we realised most occurred in settlements that were either not in our plans or in places not well monitored during campaigns,” explains Barau.
One problem was that planning for polio vaccination campaigns had often relied on hand-drawn maps, which are prone to being inaccurate and incomplete, leading to children and even entire settlements being left out.
So in December 2011, the NPHCDA and international partners, with support from the Bill & Melinda Gates Foundation, started a mapping project for eight northern states based on geographic information system (GIS) technology. It used high-resolution satellite imagery to identify and map settlements.
With a location pinned down, vaccination teams were sent out with GPS-enabled Android devices to verify which areas the vaccination campaign had covered.
In Nigeria, the mapping work “has proved extremely valuable for the government and the partners in the polio programme to reach children that otherwise may not have been [reached]”, says Vince Seaman, interim deputy director of data and analytics for global development at the Gates Foundation.
It has also sparked additional high-resolution mapping initiatives. Seaman says the Gates Foundation and its partners are bolstering their efforts to aid ever-more-detailed mapping of the population throughout Nigeria.
They are also looking to collaborate with governments to improve mapping in other countries over the next five years, starting with the Democratic Republic of Congo, Ethiopia, Tanzania and Zambia in 2018.
“The idea of open-source data has changed the face of mapping in the space of a few years”
Rebecca Firth
Beyond polio eradication, the maps and population estimates have proven their value for a variety of applications, including improving distribution of malaria bednets, tracking river blindness, and planning the installation of electric grids, says Seaman.
Mapping advances
These projects are among a variety of mapping initiatives aiming to better connect citizens with resources. In many parts of the world, large distances still separate people from health facilities, for example. And some communities can be hard to pinpoint for disease or post-disaster interventions. It doesn’t help that some countries have not had population censuses for decades.
Mapping technologies have come on in leaps and bounds, with satellites now able to map down to individual one-metre grid cells, says Andrew Tatem, director of WorldPop and co-director of Flowminder, initiatives whose population and mapping data have been used in Nigeria’s vaccination programme.
Growing computer power and widespread use of mobile phones are helping too, as is the rapidly growing store of open and community-based data.
It was partly advances in mapping tools that made it possible to produce a new global map of urban accessibility published in Nature earlier this year. It used modern data sets, including Google’s Earth Engine platform and roads data from Google and OpenStreetMap.
The map was a “marked improvement” on a version made a decade ago, says lead author Daniel Weiss, director of global malaria epidemiology at the Malaria Atlas Project (MAP), based at the University of Oxford.
The resulting map showed that just half the population in low-income regions — mainly in sub-Saharan Africa — live within an hour of a city. In high-income settings, the proportion jumps to 90 per cent. This matters because accessibility links to wellbeing — not just via access to health services, but also educational and economic opportunities.
This information can also feed into other maps and models, such as MAP’s malaria models. Weiss points out that the data and code were designed to be accessible so others can create custom accessibility maps.
Sharing data is key in boosting innovation and accuracy in mapping, says Rebecca Firth, community and partnerships manager at the Humanitarian OpenStreetMap Team (HOT), which provides up-to-date maps for relief organisations responding to disasters or health crises.
“The idea of open-source data has changed the face of mapping in the space of a few years,” says Firth.
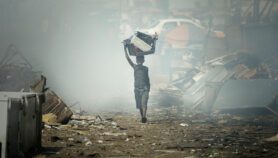
She cites the 2010 Haiti earthquake as an example of where better mapping can help the response. Responders to the post-earthquake cholera outbreak found many villages missing from the available maps, so aid was slow to reach them and the situation difficult to assess.
HOT volunteers created a map to deal with the missing information. The organisation is now pushing for preparatory rather than responsive mapping, Firth says, so maps are available right from the start, rather than days or weeks after disaster strikes.
Adoption hurdles
But while technological barriers are disappearing, there are hurdles to getting tools used on the ground beyond the academic “echo chamber”, says Tatem. This can be because of limited understanding about how maps can be used to guide local policy, or a shortage of skills and training to use the data sets, he explains.
In Nigeria, for example, researchers have reported that it was a lack of technical expertise and resources that stalled the expansion of previous small-scale GIS pilots for polio efforts before the NPHCDA’s recent initiatives.
Samir Gambhir, a GIS researcher at the Haas Institute for a Fair and Inclusive Society at the University of California, Berkeley, highlights another issue from his research in rural India. He says that even though there was a “well-thought-out” network of health facilities in rural areas, it was hard to find the data on the facilities’ resources and staff numbers.
“Using GIS procedures, one could assess accessibility to these centres, but if the centres are poorly managed, accessibility research could only go that far,” explains Gambhir.
Another challenge is understanding context, says Tatem. “A hundred cases of malaria in a population of 100 is a pretty bad situation. In a population of 10,000, it’s not so bad. But often in a country, we have no idea on those population numbers.”
In addition, it can be difficult to capture ecological and socioeconomic factors with remotely sensed data. “For the full picture, we need local community members to be mapping local features that others wouldn’t know about, or that you can’t tell from satellite imagery,” says Firth.
That’s why HOT gets local people to contribute by adding details such as road names and building types over time — a process that’s aided by the proliferation of mobile devices.
But activities on the ground can come across obstacles. In Nigeria, Boko Haram militants interrupted polio campaigns in the northern state of Borno, where a few cases of the disease resurfaced in 2016.Despite the hurdles, and over time, technology is making it possible to produce maps with unprecedented detail. As high-resolution satellite imagery and advanced machine-learning algorithms improve, says Seaman, “they become less expensive and more accurate, which makes our work better”.
What might really help hone such initiatives in the coming years are the Sustainable Development Goals and their “leave no one behind” agenda, which brings the need to track unrecorded populations into sharp focus.
“Many of the goals are focused on achieving something everywhere,” says Tatem. And that, he says, brings mapping “to the fore” as a crucial tool.
More on Health