By: Sarah Grimes
Send to a friend
The details you provide on this page will not be used to send unsolicited email, and will not be sold to a 3rd party. See privacy policy.
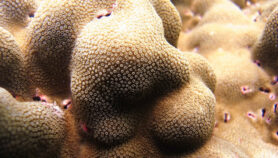
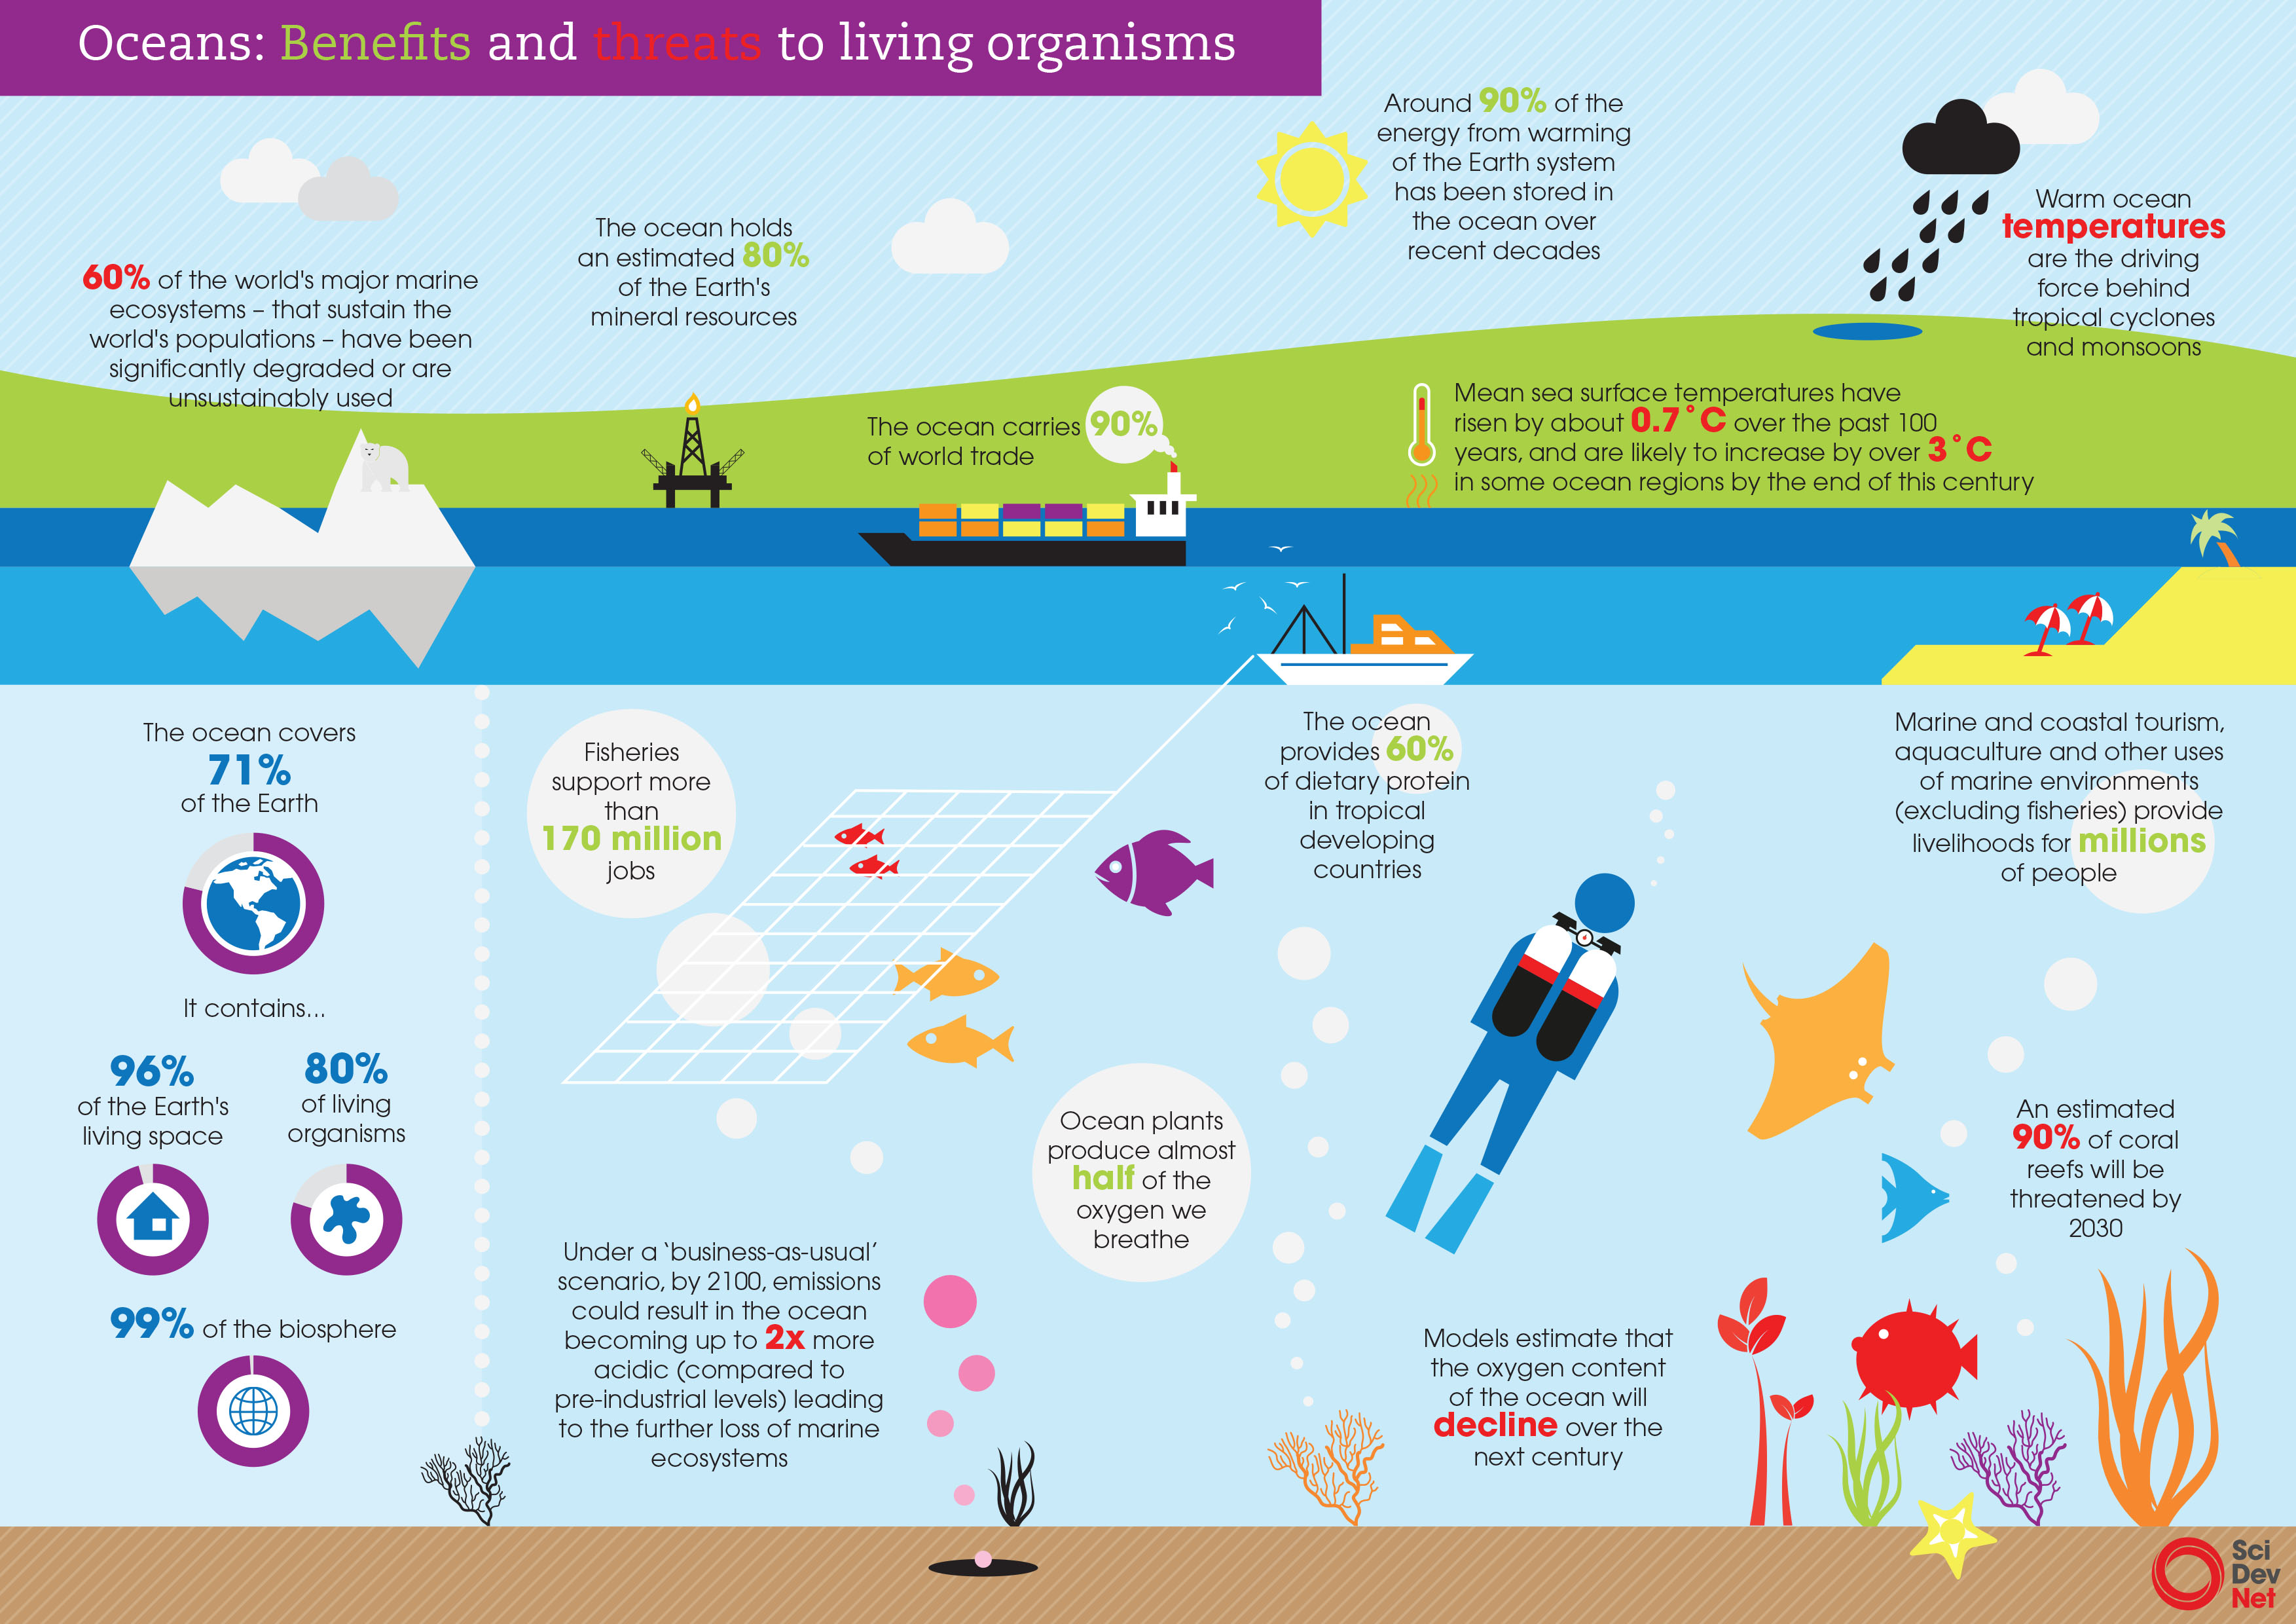
The ocean is a crucial component of the Earth system, essential for supporting ecosystem and human health by regulating the weather and climate, producing freshwater and soaking up carbon. It also provides food and other resources, trade and migration routes. Global fisheries support over 170 million jobs, not including livelihoods from aquaculture, tourism and other uses of the marine environment (Figure 1).
 Click here to enlarge
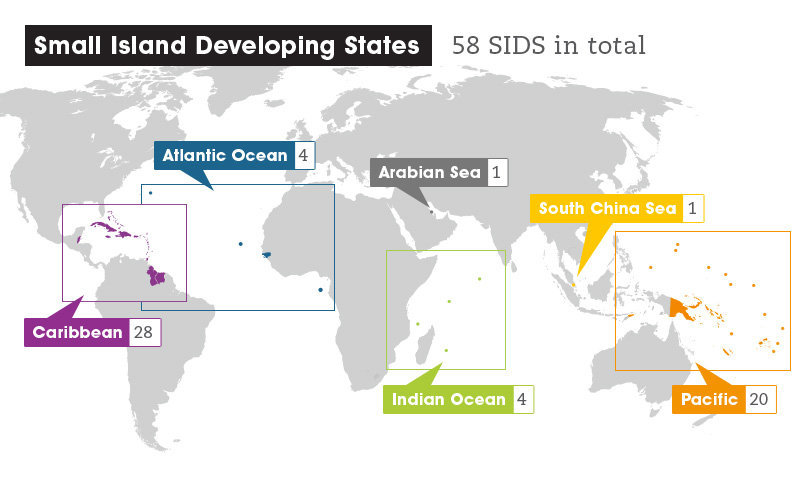
 In small-island developing-states (SIDS) the ocean drives the rhythms of nature and human life. In fact, the island nations often argue they should be called ‘Large Ocean States’, to acknowledge how the ocean isolates them within vast ‘exclusive economic zones’ (See Figure 2).
 Click here to enlarge
 But marine ecosystems are already degraded. In addition, the combined threats of warming sea temperatures, ocean acidification, de-oxygenation and pollution, to name but a few, present a pressing need to understand the marine world. Ocean science and monitoring help gather knowledge about the ocean and climate system, and improve decisions for sustainable development. In SIDS’ vulnerable ‘blue economies’, where most livelihoods rely directly on ocean resources, ocean data is needed more than ever to survive environmental challenges while moving towards international development goals.
This article explores how ocean monitoring is helping SIDS achieve these aims and highlights where they still desperately need assistance to gather and use ocean data to reduce poverty and develop sustainably.
Ocean observations
Much of the ocean remains unexplored in spite of growing recognition of its role in sustainable development. Since the 1990s, governments and researchers in both developed and developing countries have made strong commitments to ocean monitoring through the Global Ocean Observing System (GOOS) — especially physical measures such as temperature and salinity and, more recently, the biological and biogeochemical components such as plant and animal plankton, oxygen and carbon. [10, 11] GOOS is a global ocean observation network coordinated by the UNESCO’s Intergovernmental Oceanographic Commission (IOC) in partnership with the World Meteorological Organization (WMO), the UN Environment Programme (UNEP), and the International Council for Science (ICSU).
GOOS paves the way for cooperative monitoring of the ocean and seas. It does this by establishing permanent ocean data-collection platforms, such as tide gauges and ocean buoys. A good example is GOOS’ flagship Argo programme, where more than 3000 satellite controlled robotic monitoring buoys drift through the upper 2000m of the world’s oceans collecting data (see Video 1).
The raw ocean data gathered through such platforms can be processed into ‘products’ such as ocean temperature forecasts which might, for example, indicate likely fish migration patterns.
Policymakers can use ocean ‘products’ to guide decisions on development and marine management. To make this process more effective, GOOS recently boosted its efforts to collect ocean observations of ‘ecosystem Essential Ocean Variables’ (EOVs). Policymakers need such information — including on chlorophyll concentrations, harmful algal blooms, tracking of large marine vertebrates, dissolved organic chemicals, nitrous oxide and Carbon-13 — to guide urgent decisions, especially on managing marine ecosystems and their services. [10, 11]
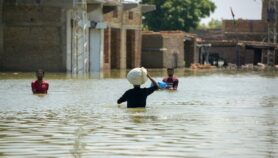
Evidence-based decision making is especially relevant for SIDS’ governments and communities, and for development aid. Table 1 outlines how ocean monitoring can benefit health and development in small-island states. In SIDS most people live in coastal habitats, rely heavily on marine resources for food, transport, tourism and trade, and are highly vulnerable to disasters such as tropical cyclones, storm surges and tsunamis. To develop without damaging the marine environment, and to build resilience to hazards, SIDS need ocean data that feeds into early warning and response systems.
| Table 1. Ocean-related monitoring activities that can benefit health and development in SIDS* |
|---|
- Fisheries (open ocean and coastal)
-
Physical ocean parameters measured Examples of monitoring technology (see definitions below) Examples of areas where data can improve knowledge How monitoring contributes to sustainable development Temperature; salinity; currents; water clarity; plankton species in a habitat (assemblages); disease-causing organisms in water; water chemistry; harmful algal blooms; eutrophication (excess nutrient levels) and oxygen depletion Argo; gliders; the Research Moored Array for African-Asian-Australian Monsoon Analysis and Prediction (RAMA); a system of moored ocean buoys (TAO); a ‘ships of opportunity’ programme (SOOPS); conductivity temperature and depth recorders (CTDs); Expendable bathythermographs (XBTs); towed continuous plankton recorders; individual monitoring buoys; satellites Ocean currents and general circulation patterns; water clarity and chemistry
Potential sources of fish food, indicated by plankton assemblages
Presence of pathogens or pollution sourcesImproved forecasting of where fish stocks will be based on physical conditions — for example, current direction/circulation, and optimum temperature and salinity.
Coastal fisheries and aquaculture stocks often depend on very specific water conditions, and the data can help management of water quality to maximise survival, reproduction and production of healthy stock.
Data on probable location of fish stock, based on sources of fish food, leads to improved catches and profits.
Monitoring pathogens and pollution can inform policies to manage risks, such as fish stocks unfit for consumption. - Climate: short-term variability and predicted climate change
-
Physical ocean parameters measured Examples of monitoring technology (see definitions below) Examples of areas where data can improve knowledge How monitoring contributes to sustainable development Ocean temperatures and currents Argo; gliders; RAMA; TAO; CTDs; XBTs; satellites > Ocean and sea surface temperatures and heights
> Ocean circulation patterns
> Strength and direction of currentsMore accurate weather forecasts, better understanding of likely climate variability and change. For example, the TAO moored buoys provide data on ocean temperature and surface wind that can improve forecasting of the El Niño Southern Oscillation (ENSO). Early warning gives communities in the Pacific Islands a chance to plan ahead for conditions such as drought (e.g. by adjusting crop planting times). - Climate change impacts
-
Physical ocean parameters measured Examples of monitoring technology (see definitions below) Examples of areas where data can improve knowledge How monitoring contributes to sustainable development Sea level heights; ocean acidification; ocean temperatures; currents and circulation Tide gauges; Argo; RAMA; TAO; SOOPS; CTDs; XBTs; satellites > Sea surface and ocean temperatures
> Ocean circulation patterns
> Strength and direction of currents
> Sea level heights
> Acidification levelsImproved forecasting of climate change impacts and planning for adaptation. For example, information on how trends in sea level change over time can inform construction of coastal settlements. This is especially useful in low-lying coral atolls. - Flooding and storm surge (generated by tropical cyclones and storms)
-
Physical ocean parameters measured Examples of monitoring technology (see definitions below) Examples of areas where data can improve knowledge How monitoring contributes to sustainable development Ocean and sea temperatures; currents
Sea level — through wave and tide heightsArgo; gliders; RAMA; TAO; CTDs; tide gauges; XBTs; satellites > Wave heights at sea and on the coast
> Predicted zones of coastal inundation, storm surge
> Predicted rainfall and areas vulnerable to river or estuary floodingImproved forecasting of the timing, strength and path of tropical cyclones, monsoons and storms — and their impacts, such as storm surges. This information gives early warning to communities on land and at sea, saving lives and mitigating damage to property. - Tsunami
-
Physical ocean parameters measured Examples of monitoring technology (see definitions below) Examples of areas where data can improve knowledge How monitoring contributes to sustainable development Sea level (through wave and tide heights) Tsunameter buoys; tide gauges; seismic equipment >Predicted height, location, impact and timing of a tsunami wave at the coast
>Predicted water inundation on landThe predictions are part of an early warning system that allows local coastal populations to move inland or to higher ground (or, if in a boat, head out to sea where the wave is less destructive). - Water quality monitoring for ecosystem health
-
Physical ocean parameters measured Examples of monitoring technology (see definitions below) Examples of areas where data can improve knowledge How monitoring contributes to sustainable development Temperature; salinity; plankton; coral reef damage (bleaching); acidification Argo; gliders; CTDs; XBTs; continuous plankton recorders; Individual monitoring buoys; satellites > Areas of visible and predicted bleaching (related to warm water temperatures)
> Presence of pollution sources
>Oxygen and eutrophication levelsMonitoring water quality in coastal areas (e.g. coral reef ecosystems) can drive action to help protect biodiversity, food sources and tourism. Warm coastal water can lead to coral bleaching. Pollution, acidification and changes in water chemistry can damage coral reefs and their economic potential. Water quality monitoring helps local authorities identify problems, promote conservation and protection measures, and put in place regulations to control sources of pollution in the longer term. - Water quality monitoring for public health
-
Physical ocean parameters measured Examples of monitoring technology (see definitions below) Examples of areas where data can improve knowledge How monitoring contributes to sustainable development Temperature; salinity; waterborne pathogens (e.g. E.coli bacteria) CTDs; XBTs; individual monitoring buoys > Water temperature data can signal optimum conditions for bacterial growth
> Presence of pathogens or pollution sources
> Indicators of flushing patterns and movement (or settling) of water with high pathogen levelsThese data warn of poor water quality; help identify areas where the water is unfit for human use; and allow management authorities to regulate water quality effectively.
*Ocean technology is described in further detail in Table 2 at the end of this article
The challenges facing SIDS
SIDS face big long-term challenges in establishing, collecting and processing ocean observations. They generally have limited resources to buy equipment and establish monitoring, and particularly lack the capacity to maintain or repair expensive kit damaged in storms or through piracy. Often, there is limited technical and human capacity to store, access and process the ocean data that do exist — or to design new monitoring technologies. Recent advances in ocean science techniques, such as remotely operated underwater vessels, tend to be used by — and for — developed countries. This is because they are designed and built in developed countries, and are too expensive for a SIDS government to buy, operate and maintain without help from donors.
Technical capacity development in island nations is essential to make even modest progress in collecting ocean data. The need is for training in how to use monitoring equipment, and how to access the data gathered and manipulate it into useful ‘products’. Financial support from developed countries is essential for this. Through regional alliances (described below), GOOS and others have set an example for how developed and developing countries can cooperate in collecting and using ocean data — through putting observation systems in place and facilitating access to donor funding, among other activities.
Focus on Caribbean SIDS
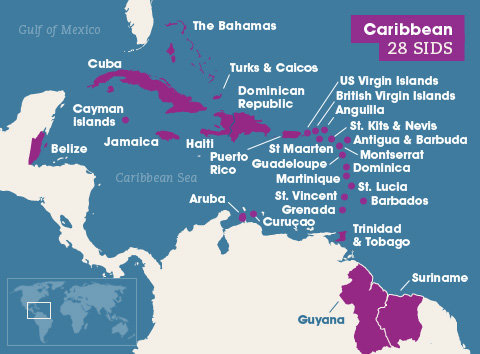
Like all SIDS, the islands of the Caribbean (see Figure 3) have marine ecosystems that are under high pressure from human impacts and environmental changes. Coral reefs and seafood stocks in this region are particularly threatened by ocean acidification, over-fishing, invasive species and unsustainable marine tourism. Caribbean SIDS also experience frequent hurricanes and storms. These damage the islands and their marine environments, endanger life and also seriously harm island economies.
These pressures place them in a vulnerable position as their economies rely heavily on marine-related tourism, and local communities’ livelihoods rely on fisheries. Tourism alone contributes more than 80 per cent of GDP (Gross Domestic Product) in Aruba, 60 per cent of GDP in Antigua and Barbuda, and an estimated 45 per cent in the British Virgin Islands. [12] Caribbean SIDS also depend heavily on safe and efficient marine transport to import goods and people, especially for the cruise ship and yachting industries. In 2013 the region was the most popular destination for cruises in the world, comprising more than 45% of the global shipping deployment. [13]
While the direct and official economic contribution of fisheries to Caribbean SIDS is generally small, they have significant value for human well-being; for example, fish is an important protein source for the local population. [14] But the role of fisheries in the region is undervalued, partly due to the challenges of quantifying small-scale, subsistence fisheries — artisanal methods are the mainstay in the wider region. [15] Over the past decade, many islands have been considering or establishing aquaculture programmes, encouraged by the availability of improved techniques. [16]
Ocean data are helping countries tackle some of the environmental challenges. IOCARIBE-GOOS, a group of island countries committed to ongoing and systematic marine observation and research, was established in 1999 and has been a GOOS Regional Alliance since 2003. It has led the establishment of the Caribbean Tsunami Early Warning System in 2006 and has been instrumental in the establishment of the Caribbean Large Marine Ecosystem Project in 2001. It now focuses on demonstrating the value of national and regional ocean observations and forecasts within the region, and providing tools and advice on their availability, use, and sharing. This is slowly advancing local capabilities to operate and maintain equipment and systems, and to use the information they provide.
The ultimate aim is to pave the way for countries to continue this work collaboratively. Co-ordinated ocean observations across the islands should help to improve early warnings of environmental changes such as damaging storms, and could lead to other early warning systems to complement the Tsunami Early Warning System. Although the immediate obstacle to establishing such systems is funding, the underlying problem is that Caribbean island nations have yet to be convinced of the economic value.
Focus on Pacific SIDS
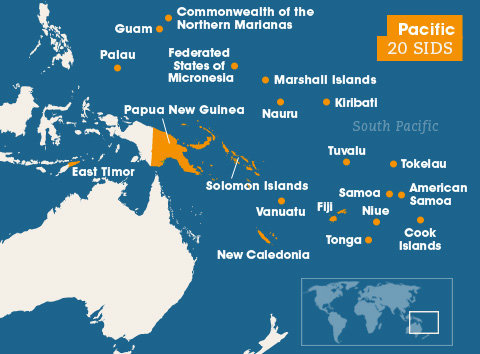
The challenges of making informed marine management and policy decisions for sustainable development are greatest for SIDS isolated in vast ocean areas — such as most of the Pacific Islands (see Figure 4). Without long-term monitoring they are unable to distinguish human-caused environmental change from natural variability. The Outlook Report on the State of the Marine Biodiversity in the Pacific Islands Region, produced for the Secretariat of the Pacific Regional Environment Programme (SPREP) in 2010, clearly shows there is insufficient information on fisheries stocks, nutrient loads and water temperatures. [6] World Bank figures put eight Pacific Islands in the ‘top twenty’ countries for average annual losses through disaster, weighted by GDP. [17] Most disasters in this region are caused by ocean-related events. For example, tropical cyclones driven by warm ocean temperatures cause coastal flooding. Tsunami risk is also high in this earthquake-prone region.
The Australian and US governments helped address this need for ocean information by helping establish the Pacific Islands' GOOS in the early 2000s. This programme has been building a platform for coordinated ocean observations and related applications across the region. As well as monitoring ocean and coastal parameters, PI-GOOS has helped to build scientific capacity. Through training and the provision of equipment, islanders have learned more about how oceans and climate affect sustainable development; appropriate monitoring techniques for local and remote areas; and data processing to inform sustainable marine and disaster management. In 2013, for example, the WMO-IOC Joint Technical Commission for Oceanography and Marine Meteorology worked with partners to co-ordinate the Fiji Stakeholders Workshop for WMO Coastal Inundation Forecasting Demonstration Project. With donor assistance from the Korean government and in partnership with PI-GOOS and the Fiji Meteorological Service, the project initiated an assessment of national capability for forecasting coastal flood risk and evaluating related emergency management structures in Fiji.
The Argo Programme (shown in the cartoon above) has particularly benefitted SIDS in the Pacific. The programme’s education component, which ties in with PI-GOOS, has led to the design of teaching material specifically for tropical Pacific Island schools. Argo data has also helped scientists understand the upper ocean and its interactions with the atmosphere, which shed light on patterns of ocean climate variability. Combined with other oceanographic data, Argo has fed into forecasting models that produce more accurate predictions of seasonal to decade-long climate variability. This helps to refine predictions of El Niño and La Niña events, which have profound effects on Pacific SIDS. For example, fish stocks may shift their migrations as they follow warmer waters; sea level changes significantly in some coastal areas; prolonged droughts damage crops such as banana and taro; and more frequent and severe storms put populations at risk. A cartoon animation was specifically developed by various international donors, the Red Cross and SPREP to help islanders understand oceans, weather and climate variability and their impacts on livelihoods, and so better prepare for change (see Video 2).
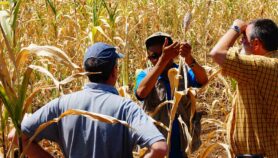
Other serious threats facing many Pacific SIDS, which are often low-lying coral atolls, relate to climate change. These include acidification, coral bleaching (due to seawater warming) and rising sea levels. Sustained ocean observation programmes, supported by the Australian government, have shown a rising trend in coastal sea level across the South Pacific over the past 20 years. This is helping to focus attention on those Pacific Island countries most urgently needing coastal adaptation strategies. Ocean data and products can also be used to identify new research areas and ways to apply the information for societal benefit. In Fiji, for example, better understanding of how rainfall and other climate patterns can affect sugarcane — the island’s third highest earning industry — is crucial for farmers’ capacity to build resilience by changing planting or harvesting practices. [18]
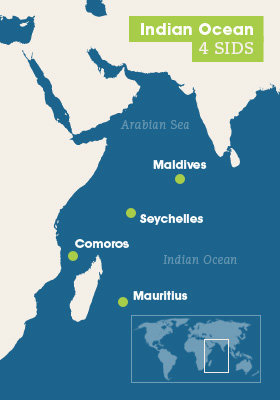
Focus on Indian Ocean SIDS
The Indian Ocean has fewer SIDS than other regions, and these islands are extremely isolated (see Figure 5). Their economic mainstay tends to be marine tourism, followed closely by fisheries. In the Seychelles, for example, tourism and tuna fishing together make up more than 70 per cent in hard currency earnings, and 30 per cent of the nation’s jobs. [12]
As with other regions, Indian Ocean SIDS rely on healthy marine environments for their economies and livelihoods. And they face the same threats — especially degraded coral reefs, ocean acidification, over-fishing, pollution, sea level change, storm and other marine hazards. In particular, real-time seismic and sea level observations are needed to issue tsunami early warnings for SIDS and all coastal countries at risk. The tragic Indian Ocean Tsunami of 2004 highlighted the lack of relevant ocean observations and warning systems there and in other coastal areas. In response, the international community, through the UN, tasked the IOC with setting up an early warning system to minimize further loss of life from these natural disasters in the Indian Ocean and other regions.
Ten years on, much progress has been made but much also needs to be done to ensure these systems remain operational.
For ocean and storm forecasting, and understanding marine environments in general, the Indian Ocean GOOS community has worked collaboratively to collect ocean data and store them in central repositories, making it accessible for analysis. That said, the Indian Ocean SIDS receive far less assistance in harmonising and using the data collected than do the Pacific Islands, where a coordinator facilitates regional and donor activities. This is a governance challenge unique to the Indian Ocean region, where islands are sparsely distributed and poorly connected. A concerted effort is needed to strengthen the limited network of ocean monitoring across the SIDS community there. This is starting to occur through the efforts of IOGOOS and other project alliances such as the Indian Ocean Panel, an international programme called Sustained Indian Ocean Biogeochemistry and Ecosystem Research (SIBER) and the Ocean Data and Information Network for Africa (ODIN-Africa). The logistical problems of coordinating over great distances can be reduced by building on these initial efforts. Donor funding remains a key challenge.
Regional comparisons
The regional variations described above show that lumping SIDS together can conceal important differences. In the Caribbean and the Pacific, for example, collaborative ocean monitoring has strengthened the islands’ sharing and use of data. For the Caribbean, proximity to the more wealthy Americas and a history of European influence has helped some island states access data or secure donor funding — even where island governments remain unconvinced of the need for sustained monitoring. Yet even this region still needs to make more timely use of information to improve early warnings and manage marine-based tourism sustainably. In the Pacific, SIDS suffer more frequent natural disasters, have less resources and face greater isolation from developed countries — but despite ongoing challenges, they have been helped significantly by international support and close collaboration between governments. In contrast, the few Indian-Ocean SIDS have little ‘regional’ co-ordination of ocean monitoring, and face additional challenges such as piracy and vandalism of monitoring equipment. They rely mainly on the spin-off benefits (often opportunistic) of programmes and projects that occur ‘around them’ but are driven and run by other entities. So in this region, gathering ocean data and creating ‘products’ is a difficult process improving only slowly, supported to some extent by the Indian Ocean rim countries and donors.
SIDS overall may be wealthy in marine resources, but do not necessarily have the governance, enough data and research structures to use this wealth sustainably, or to manage environmental risks.
Technical institutions, technological capacity and funding are in short supply. The islands remain dependent on the ocean — and also on more developed countries to help them gather, access and use data, and to build their capacity to take ownership of monitoring activities and decision-making processes. This assistance is sometimes ad-hoc, (for example during extreme weather events). Some longer term help is available through the GOOS networks’ training or other activities.
From Rio+20 to the 2014 UN SIDS Conference and beyond
The UN’s Rio+20 international conference on sustainable development in 2012 was a meaningful ‘win’ in the drive to place ocean ecosystems firmly on the international agenda — and this, in turn, benefits SIDS and their specific needs. ‘The Future We Want’ outcome document from Rio+20 committed to protecting and restoring the health, productivity and resilience of oceans and marine ecosystems (paragraph 158). [19] Other significant outcomes included a strong commitment to continue strengthening developing countries’ capacity to profit directly from conserving and sustainably using marine environments (paragraph 160). This was a clear direction to enhance marine research and technology transfer to enable SIDS to monitor and have better access to ocean data. Significantly, the outcome document reaffirmed SIDS’ particular vulnerability and need for special assistance (paragraph 178).
Through the international process of developing global Sustainable Development Goals (SDGs — to succeed the Millennium Development Goals and run from the end of 2015), and in the run-up to the third International SIDS Conference in September 2014 in Samoa, SIDS have been stepping up the pressure on the international community to maintain and go beyond the commitments made at Rio+20. A specific SDG for the ocean has survived the competition as one of 17 goals being considered at the time of publication. Within that ‘ocean goal’ there are several references to SIDS, the main one articulating the aim to “increase scientific knowledge, develop research capacities and transfer marine technology taking into account the Intergovernmental Oceanographic Commission Criteria and Guidelines on the Transfer of Marine Technology, in order to improve ocean health and to enhance the contribution of marine biodiversity to the development of developing countries, in particular SIDS and Least Developed Countries (LDCs)”. [20]
SIDS are also calling for wealthier nations to help them finance improvements to their capacity to uphold international commitments. Developed countries — especially neighbours or countries with historical ties to SIDS — are well placed to continue leading efforts to share new technologies and develop national capacity. These concerns remain firmly on the Samoan Conference Agenda, with ‘Oceans’ being one of six priority multi-stakeholder partnership dialogues. [21] There’s much at stake: sustainable ocean and ecosystem management, reduced risk from ocean-related natural disasters, and nothing less than the survival of small island states.
Sarah Grimes is a programme specialist at the UNESCO's Intergovernmental Oceanographic Commission (IOC) in Paris. She has worked extensively on GOOS activities for the Pacific Island and Indian Ocean regions.
In preparing this article she acknowledges input from Cesar Toro and Patricia Wills-Velez at the IOC Office for the Caribbean and Adjacent Regions; Doug Wilson from of IOCARIBE; Robin Mahon from the University of the West Indies; Julian Barbière, Tom Gross and Thorkild Aarup at IOC Paris; Nick D’Adamo and Louise Wicks at IOC Perth, and Tommy Moore from SPREP.
> Link to previous version of the article 'Ocean science for sustainable development: Facts and figures' which was part of the Spotlight 'Ocean science for sustainable development' with additional views and resources on ocean science
| Table 2. Ocean technology | |
|---|---|
| Argo | The Argo Programme is a global array of free-floating monitoring equipment that collects data such as salinity and temperature from the upper ocean (sea level to 2000m depth). This lets scientists characterise the upper ocean and patterns of ocean climate variability, including heat storage. Argo data can also be used as starting points — in combination with other oceanographic data — for ocean and coupled ocean-atmosphere forecasting models, enabling more accurate predictions of seasonal to decade-long climate variability [22] |
| AUVs | Autonomous underwater vehicles are remote-controlled robots that can be tailored to meet the needs of the user. For ocean science purposes they may contain technologies such as sensors for depth and sonar, which are used to record ocean conditions as they move through the water. Argo floats and gliders (defined below) are examples of AUVs [23] |
| Continuous plankton recorders | A monitoring programme using towed nets to measure phytoplankton and zooplankton at various ocean depths. Plankton are sensitive to changing ocean conditions and therefore indicate environmental changes or variations on food supplies. [24] |
| CTDs | Conductivity, Temperature and Depth Sensors: These record physical properties of ocean water such as temperature, salinity and density. Once collected, the data are transmitted in real time back to a central area (e.g. on ship or land). Traditionally, a CTD instrument is lowered overboard from a ship to a depth up to 2000 metres and for a 2-5 hour period. More recently, CTDs have been used on autonomous monitoring equipment (such as the Argo floats), where observations are transmitted via satellite back to a central database on land. Other instruments can be attached to a CTD to measure additional parameters; for example to measure the dissolved oxygen content of the water [25] |
| Glider | A type of autonomous underwater vehicle (AUV) [see definition above] that is driven by a variable buoyancy system instead of a traditional propeller [23] |
| Individual monitoring buoys | These are designed for specific monitoring needs — usually below the water, at the ocean surface. They often include instruments to measure wind speed and direction, air and ocean temperature and chlorophyll concentration [26] |
| RAMA | The Research Moored Array for African-Asian-Australian Monsoon Analysis and Prediction: A moored buoy array, in the data-sparse Indian Ocean, that advances forecasting and research for monsoons [27] |
| Satellites | Satellites allow a global view and measurement of certain ocean conditions. An example is the JASON satellite, which can accurately measure the sea surface height, helping scientists calculate the direction and speed of ocean currents and ultimately improve understanding of weather and climate [25] |
| SOOPS | Ships of Opportunity is a programme that allows commercial, merchant or smaller vessels to volunteer to gather oceanographic data during their voyages. SOOPS vessels may carry instruments such as CTDs, XBTs and continuous plankton recorders. The data collected are usually made freely available through the GOOS [28] |
| TAO/TRITON | Tropical Atmosphere Ocean Project: Since the 1990s, approximately 70 moored ocean buoys placed in the tropical areas of the Pacific Ocean have produced real-time oceanographic and meteorological data transmitted to land through the Argos satellite system [29] |
| Tide gauges | Usually located on the coast, these devices can detect changes in the height of coastal sea water relative to a standard level on land (the datum). Changes in global sea levels over much of the past century have been measured by tidal gauges [30] |
| Tsunameter buoys | A deep ocean pressure sensor that can detect (to the millimetre) variations in ocean height from the deep sea — and therefore the presence of a tsunami wave generated far from the coast. Tsunameter buoys are integral to tsunami early-warning systems [31] |
| XBTs | Expendable Bathythermographs: These allow ocean scientists to record measurements of ocean temperature down to 1500 metres and usually over a 24-hour period. Similar to CTDs, they are usually dropped over the side of a ship. Temperature data are transmitted back to the ship via a wire cable [32] |
References
[1] Jesse Ausubel and others (eds.) First census of marine life 2010: highlights of a decade of discovery (Census of Marine Life Secretariat, 2010)
[2] Patricio Bernal. For the ocean. In: Holland, G. and Pugh, D. (eds.) Troubled waters: ocean science and governance (Cambridge University Press, 2010)
[3] Geoff Holland and David Pugh, D. (eds.) Troubled waters: ocean science and governance (Cambridge University Press, 2010)
[4] Hot, Sour and Breathless – Ocean under stress: How is the biggest ecosystem on Earth faring in the lead up to Rio+20 . (A report coordinated by the UK’s Plymouth Marine Laboratory, 2011)
[5] IOC/UNESCO and others. A blueprint for ocean and coastal sustainability. (IOC/UNESCO, IMO, FAO, UNDP, 2011)
[6] Jeff Kinch and others Outlook report on the state of the marine biodiversity in the Pacific Islands Region. (SPREP, 2010)
[7] Gunnar Kullenberg. Ocean Science: an overview. In: Geoff Holland and David Pugh (eds.) Troubled waters: ocean science and governance (Cambridge University Press, 2010)
[8] UNEP. Towards a Green Economy: Pathways to sustainable development and poverty eradication — a synthesis for policy makers. (UNEP, 2011)
[9] IGBP and others. Ocean Acidification Summary for Policymakers – Third Symposium on the Ocean in a High-CO2 World. (International Geosphere-Biosphere Programme, Stockholm, Sweden, 2013)
[10] IOC. Report of the first workshop of technical experts for the Global Ocean Observing System (GOOS) Biology and Ecosystems Panel: identifying Ecosystem Essential Ocean Variables (EOVs) (IOC-UNESCO, 2014)
[11] IOCCP. First technical experts workshop of the GOOS Biogeochemistry Panel: defining essential ocean variables for biogeochemistry (IOCCP, 2014)
[12] Central Intelligence Agency (CIA) The World Factbook (CIA, accessed August 2014)
[13] Caribbean Tourism Organisation (CTO) Caribbean Tourism Review 2014 (CTO, 2014)
[14] Bisessar Chakalall and others Governance of fisheries and other living marine resources in the wider Caribbean (Fisheries Research, October 2007).
[15] Daniel C. Dunn and others. Regional analysis of coastal and domestic fishing effort in the wider Caribbean. (Fisheries Research, February 2010)[GS1]
[16] FAO Fisheries Report of the Sub-regional Workshop to Promote Sustainable Aquaculture Development in Small Islands Developing States of the Lesser Antilles (Report No 704 FAO, Rome 2003)
[17] World Bank and GFDRR Acting today for tomorrow – policy and practice note for climate and disaster resilient development in the Pacific Islands’ Region with supporting research, analysis and case studies (World Bank, Washington, USA 2012)
[18] Global Education. Case study: South Pacific sea level monitoring (last updated 2012)
[19] UN General Assembly The future we want Rio+20 Outcome Document. (UN General Assembly, June 2012)
[20] Open Working Group on Sustainable Development Goals Outcome Document (SDG OWG, 2014)
[21] Nicholas Robson. UN releases six briefs for SIDS conference partnership dialogues (Small Island Developing States Blog, 7 August 2014)
[22] The Argo programme (Argo, 2014)
[23] Autonomous Underwater Vehicles (Woods Hole Oceanographic Institution, 2012)
[24] The CPR Survey (SAHFOS, 2010)
[25] Ocean Instruments (Woods Hole Oceanographic Institution, 2012)
[26] Water buoy monitoring systems (FONDRIEST Environmental, 2011)
[27] Michael J McPhaden and others. RAMA – the Research Moored Array for African-Asian-Australian Monsoon Analysis and Prediction. (American Meteorological Society Journal 90, 459–480 (2009)
[28] Ship of Opportunity programme (JCOMMOPS, 2012)
[29] Tropical Atmosphere Ocean Project (Pacific Marine Environment Laboratory, 2012)
[30] Tide gauge sea level (Colorado University Sea Level Research Group, 2011)
[31] Ocean data buoy vandalism: incidence impacts and responses (Data Buoy Cooperation Panel, International Tsunameter Partnership 2011)
[32] Upper Ocean Thermal Centre (NOAA, 2012)
More on Water