By: Jessica Hamzelou
Send to a friend
The details you provide on this page will not be used to send unsolicited email, and will not be sold to a 3rd party. See privacy policy.
Google has launched a new online tool enabling free data-sharing that could aid with international scientific research collaborations.
The tool, Fusion Tables — launched on the Google Labs website — allows tables of data to be visualised as charts, graphs and maps, which can help identify patterns and trends.
Users are able upload their data and make the information freely available to anyone, opening up possibilities for collaboration.
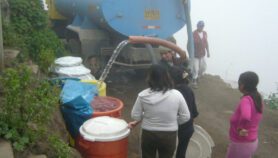
The Pacific Institute, an environmental research organisation, is already using the tool. Together with media network Circle of Blue they have provided free international access to global freshwater data.
Alon Halevy, senior engineer at Google Labs, told SciDev.Net: "We wanted to make it easier for people to share their data, to save it and make it searchable on the web … We want to unlock data from its current repositories and let more people get value out of it."
Google is currently in conversation with several non-profit and government-funded organisations in an effort to increase the available online information.
Since the tool’s launch in June ClimateWizard — a collaboration between The Nature Conservancy, the University of Washington and the University of Southern Mississippi — has uploaded data on global climate change predictions.
The Centre for Agriculture and Biosciences International (CABI) may contribute information to the tool in the future. Communications manager Sarah Wilson told SciDev.Net: "It’s a very interesting piece of kit, and we’ll be watching it develop."
Halevy also highlights education as a key area for application of the accumulated data: "I think Fusion Tables is a great tool for teachers in the classroom to let students investigate their own data, integrate it or fuse it with data from other places, and make the data come alive by visualising it on maps." He says he would love to see the tool applied to teaching in developing countries.
More on ICTs