By: Rhitu Chatterjee
Send to a friend
The details you provide on this page will not be used to send unsolicited email, and will not be sold to a 3rd party. See privacy policy.
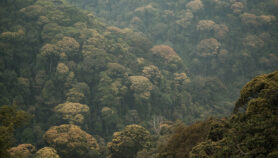
Remote sensing is crucial for getting the measure of forest loss. Countries don’t need their own satellites but they do need training.
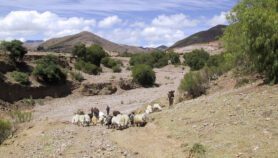
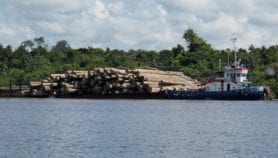
Cordillera Azul stretches eastward from the foothills of the Andes. These isolated mountains cover thousands of square miles and their rich and untouched forests were declared a national park in 2001. Yet the forests surrounding the national park are swiftly being converted to roads, cash crop plantations and other development projects. To survive, Cordillera Azul National Park needs money, and it believes that one long-term solution will be REDD (strategies for reducing emissions from deforestation and forest degradation).
Peru, like every other country wanting to embrace REDD, must first tackle some technical tasks. The most important is to be able to measure, verify and monitor the emissions coming from deforestation. It’s a challenge, but new science has lowered the hurdles.
Eyes in the sky
To calculate the extra carbon released when a forest is chopped down or degraded, we must know precisely what area is affected and must estimate how much carbon that forest stores. The quality of these data could make or break REDD initiatives. Satellites have been monitoring forest cover since the 1990s at global, national and regional levels, providing data for forest cover maps. Brazil and India have been mapping their forests for over a decade.
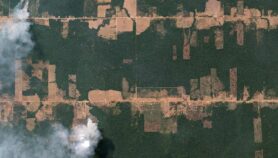
Large-scale deforestation, i.e. in patches extended by more than 25 hectares, — is easily spotted using satellite images from sensors such as the U.S. National Aeronautics and Space Administration (NASA)’s Moderate Resolution Imaging Spectroradiometers (MODIS). Smaller patches can be detected using satellites offering higher resolution imagery, such as those used by Brazil’s Amazon Deforestation Monitoring Project, PRODES. Deforestation hotspots, once identified, can then be examined more carefully using ground or airborne observations.
No satellite, no problem
Even countries without their own satellites, like Peru, are finding this remote sensing data handy. The country has "just one" national-level forest cover map from, 2001, says Lucia Ruiz Ostoic, technical director of the non-governmental organisation charged with protecting Cordillera Azul (the Center for Conservation, Investigation, and Management of Natural Areas, or CIMA). But that has not prevented Ostoic and colleagues mapping deforestation in the park and its surroundings.
By analysing land cover data collected by satellites such as NASA’s Landsat series and the French Systeme Pour l’Observation de la Terre (SPOT), they have mapped forest cover from 1996-2007.
One difficulty for such an enterprise is that data delivery is not standardised, says Peter Holmgren, director of the U.N. Food and Agricultural Organization’s (FAO) Natural Resources Management and Environment Department. It is often hard to wade through the satellite data and make sense of it.
Gregory Asner, and colleagues at the Carnegie Institution’s Department of Global Ecology at Stanford University, are confident that the problem will soon be solved. They have developed a desk top application, called Carnegie Landsat Analysis System Lite (CLASLite), to help local forest managers and government agencies interpret satellite data. "We’re going to have to make it accessible to non-experts, people who are working on the applications of forest cover and deforestation, but who are not remote sensing experts," says Asner.
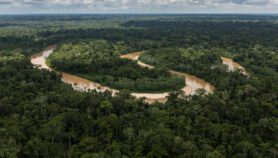
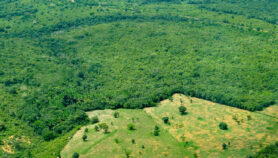
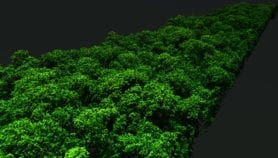
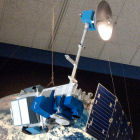
The French satellite SPOT-5 has helped the Peruvians produce a forest map of Cordillera Azul
CNES
"CLASLite takes in the raw data and does a 100 per cent automated conversion … into three types of maps: forest cover, deforestation, and degradation," he explains. On a regular laptop, CLASLite takes about an hour to map 10,000 square kilometres.
He developed the software using grants from foundations. Now, he is distributing it in Latin American countries and studying how best to use it elsewhere in the tropics.
Ostoic is delighted with this gadgetry. Earlier this month, she and colleagues from 52 agencies in five Latin American countries attended a CLASLite workshop, learning how to use the software and combine it with other tools to estimate carbon stocks.
Measuring degradation
But the other component of REDD — degradation — is an altogether more elusive task.
"Degradation is another story," says Fred Stolle, programme manager of the Forest Landscape Objective, at the US-based World Resources Institute, in Washington DC. As a concept, degradation is less tangible and there is no universally acceptable definition. Its causes range from selective logging and burning, to periodic harvesting of firewood. It can be prolific and damaging but it can occur in tiny pockets scattered over the forest and be much harder to spot with remote sensing.
Some experts, like Asner, are certain that advances in remote sensing and more sophisticated analytical methods will resolve the problem in time. But even he agrees that the best approach will be to combine remote sensing data with information from field plots.
Seeing the wood in the trees
The other requirement of REDD is estimating just how much carbon is locked up in a particular forest. Typically, about 47 per cent of a tree’s biomass is carbon, says Holly Gibbs, a land use expert at Stanford University’s Program on Food Security and the Environment. "The only way we can directly measure carbon is to cut the tree down, dry it out and actually just weigh it," she says.
Traditionally, ecologists and forestry researchers do this and then devise ways of scaling up the measurements, Gibbs explains.
For example, the biome-average method synthesises a few rough numbers for different categories of forests, some broad numbers for each type of forest’s carbon stocks, and paints the summary onto land cover maps. The results, says Gibbs, are globally consistent but highly uncertain.
Another, more precise method is a forest inventory that uses the diameters of the trees and their heights to estimate biomass. The UN FAO compiles such inventories for countries around the world but these are slow to produce and can be spotty and inconsistent.
Gibbs and colleagues summarised the existing methods for estimating carbon stocks in tropical forests in a paper published in the journal, Environment Research Letters in 2007.
Could remote sensing help? Radar sensors on satellites and airborne laser sensors show promising results, but remote-sensing remains expensive and technically demanding. In a decade’s time, say researchers, increased investment and research may fell these technical obstacles. For now, combining existing remote sensing techniques with field measurements gives countries reasonably good estimates of the carbon lost from tropical forests. And field measurements will always be vital, say researchers. "We really need to get boots on the ground to collect the information on carbon stocks," notes Gibbs. "Really, no matter what else we do, no matter what type of measurements systems we design, we’re going to need to get people out there." Ostoic agrees. But it’s expensive to estimate carbon stocks, she says, especially for the early stages of a REDD project.
Fixing a baseline
Perhaps the toughest problem facing Cordillera Azul is that, to qualify for REDD money, you need to show how much forest would be lost if nothing was done – i.e. provide a baseline.
This may seem simple – why not project forward from historical deforestation and degradation rates? That’s fairly easy for countries like Indonesia that are losing forest at an alarming pace. Satellites like Landsat have been collecting land cover information since the 1970s, giving clear historical information, says Nadine Laporte, a land use researcher at the Woods Hole Research Center in Massachusetts, U.S.A.
But in central African countries, for example the Democratic Republic of Congo (DRC), historical deforestation rates are very low, says Laporte. War and political unrest have, until recently, kept investors away.
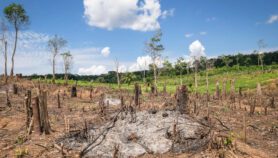
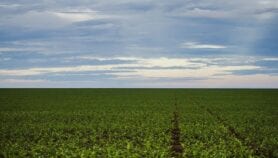
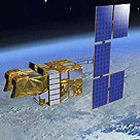
Data from the American space agency Nasa’s Landsat helps map forest cover
Flickr/cliff1066
Now however, investors from all over the world, including China and France have come flocking. "I think things are going to change fast," says Laporte. Deforestation is likely to increase and historical deforestation rates will not help the Central African countries predict how fast this change will be. Baselines for current emission rates are deeply controversial, says Mario Boccucci, the senior programme officer of the UN Environment Programme’s Forests and Climate Change Division, in Kenya. And the solution will be more political than scientific, he adds. Laporte also points out that Indonesia and Brazil are pushing for a historical baseline while central African countries like the DRC are insisting on using macroeconomics-based predictions of future emissions.
The issue is tricky for Cordillera Azul, too. Although there has been no war, unlike the DRC, neither have there been high deforestation rates like Indonesia. When CIMA and its collaborators — the Peruvian government and the Field Museum in Chicago — tried to predict deforestation rates the GEOMOD model they used failed to reflect the reality on the ground.
Monitoring, year after year
Monitoring will help, but it takes time and money. "Monitoring gets more and more powerful if you do it year after year," notes Stolle. But countries "hardly… take the effort to do this systematically." Sometimes there’s no political will, but very often there’s insufficient funds, infrastructure and human capacity.
Countries differ widely in their capacity to monitor and measure emissions from their forests. At one extreme is Brazil, the country with the largest tropical forest and the single largest emitter of greenhouse gases from tropical forest loss —30 per cent of global emissions from deforestation. Brazil is also one of only two developing countries with a long-running forest monitoring programme. Its Amazon Deforestation Monitoring Program (PRODES) produces high resolution imagery that should help meet Brazil’s target of halving emissions from deforestation and degradation by 2018.
Most other countries are lagging well behind. DRC, for example, still lacks enough trained people to systematically analyse remote sensing data, says Laporte.
The DRC holds the second largest surviving tropical forest in the world, and recently received US $200,000 from the World Bank’s Forest Carbon Partnership Fund to begin work on REDD. Laporte, who is helping the DRC’s Ministry of Environment develop a national REDD strategy, says that’s too little and took too long (two years) to get. "And it’s a pity!" she says. "You can’t ask countries to move fast on something if they don’t have money to do it."
Such varying capacities mean there cannot be a uniform standard in REDD projects, at least in the beginning. "The key thing about REDD is that different countries can enter at different levels," notes Asner.
The Intergovernmental Panel on Climate Change (IPCC) has produced good practice guidelines for developing carbon assessment systems. The guidelines are divided into three tiers, each a more accurate system of carbon accounting that the last. If REDD becomes part of a post-Kyoto international climate agreement, many countries should be able to enter REDD under Tier 1, which is the crudest accounting of forest cover and carbon stocks, experts say. Gradual improvements in technology and capacity should eventually allow for reporting under Tier 2 and 3, they hope.
It is important to remember that "REDD may not be the perfect thing right now," notes Laporte. "But it’s the only kind of economic tool we may have to slow down really big deforestation."
More on Forestry